August 10, 2026
Turning Your Job Search Into Data
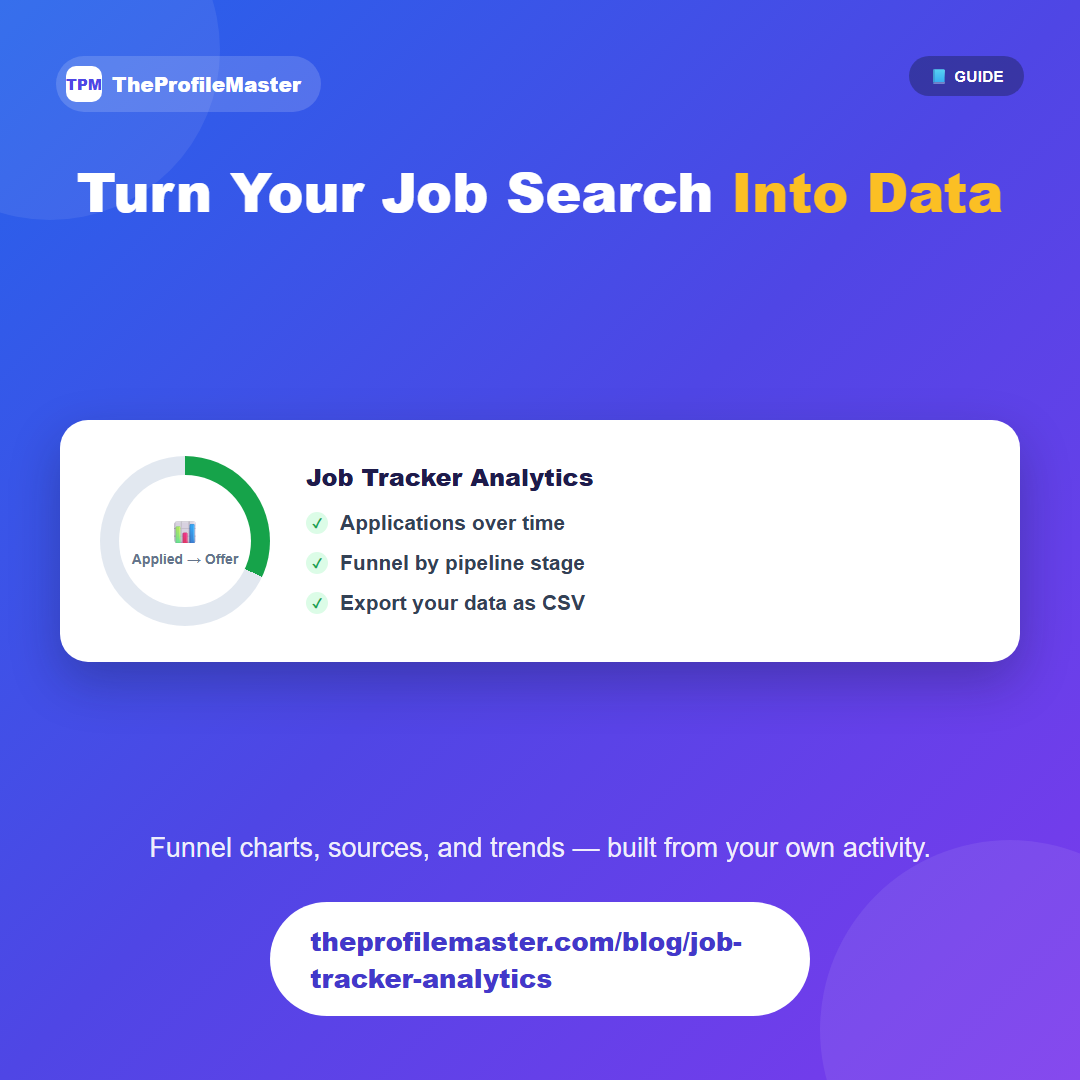
The Analytics tab on the Job Finder page turns your Job Tracker activity into a set of stat tiles and charts — how many applications you've logged, how they're distributed across pipeline stages, and how your activity has changed over time.
A funnel chart shows how many applications make it from "Applied" through to "Interviewing" and "Offer," which is a useful way to see whether the bottleneck in your search is getting responses at all, or converting interviews into offers. A source breakdown shows where your leads are coming from.
If you want to work with the numbers yourself, or share them with someone helping you with your job search, you can export the underlying data as a CSV.
This tab is most useful once you have some history logged in the Tracker — a single week of data won't say much, but a month of applications is usually enough to show a real pattern, like whether one source is consistently converting better than another, or whether your response rate drops off after a certain point in the funnel.